Historical Patterns and Structural Opportunities in A-Shares
As investors navigate June’s traditionally volatile markets, analysis of 34 years of A-share data reveals volume trends rather than calendar effects will likely determine this month’s performance, with structural opportunities emerging in specific sectors like biopharma despite range-bound indices.
Historical Context
| Period | June Performance | Key Characteristic |
|---|---|---|
| 1990-2023 | 17 up / 17 down months | No inherent “June slump” pattern |
| April-May 2024 | 1.2% range | Post-national team stabilization |
Current Technical Landscape
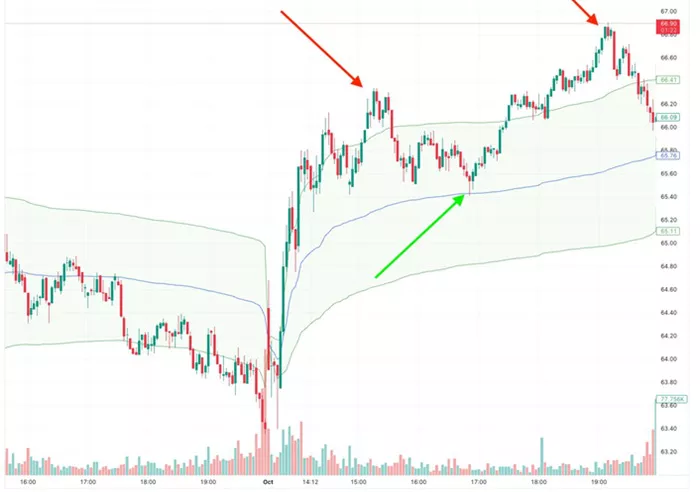
- Index Range: 3,319-3,400 (1.4% bandwidth)
- Volume Signal: Consistently below ¥1 trillion daily
- Market Behavior:
- Support zone bounces = entry opportunities
- Resistance tests = profit-taking signals
Sector Opportunities
Differentiating structural plays from cyclical moves:
| Sector | Outlook | Rationale |
|---|---|---|
| Traditional Consumer (Auto/Baijiu) | Cautious | Fundamental deterioration |
| New Consumption | Selective | Valuation concerns after HK rally |
| Biopharma Innovation | Positive | Global partnership model emerging |
Biopharma Breakthrough
China’s drug innovators demonstrate competitive advantages:
- Efficiency Edge:
- Pre-clinical: 1-2x faster than global peers
- Clinical trials: 5x speed advantage
- Strategic Shift: From fast-follow to global co-development
- Financial Benefits: Risk-sharing through MNC partnerships
Investment Strategy
In current conditions, investors should:
- Monitor volume breakout for directional signals
- Focus on sectors with fundamental momentum
- Utilize range-bound index to time entries/exits
- Prioritize innovators with global pipelines
The biopharma sector particularly exemplifies how Chinese companies are transitioning from domestic players to global competitors through strategic partnerships and operational excellence.
Related topics:

